Basic BI package
Use the curated business areas when you want a smaller reporting model with fewer relationships to manage. It is the better starting point for most first Power BI builds.
Accounting star schema for Power BI
Datplan's BI package turns supported source data into stable fact and dimension files with semantic metadata and relationship guidance for Power BI, Tableau and Qlik. The aim is not to create the largest possible model; it is to make the reporting grain understandable.
Reviewed and updated 6 September 2026
It is a reporting model where fact tables hold measurable events or balances at a defined row grain and dimension tables supply reusable context such as dates, accounts, contacts or items. The key control is knowing what one fact row represents before you aggregate it.
A practical finance model
Microsoft's Power BI guidance recommends consistent fact-table grain and clear fact/dimension relationships. Accounting data makes that especially important.
| Fact family | Typical row meaning | Example question |
|---|---|---|
| Financial summary | Account or report row at a reporting period/date | What is revenue this month? What is cash at period end? |
| Document | One invoice, bill or other source document | How many invoices are overdue? |
| Document line | One item/account line within a document | Which products or tracking categories drove sales? |
| Payment | One settlement or allocation event | When was cash collected? |
| CRM activity | One supported call, meeting or other activity | How much sales activity occurred? |
Fact and dimension package
The Datplan BI export writes supported fact and dimension tables plus machine-readable semantic information and relationship guidance. Power BI still remains your model: you choose the measures, report pages and publication route.
The source data and prepared reporting files can remain in your Windows environment or be deliberately written to an organisation-controlled shared location. Datplan does not require a hosted data warehouse for this workflow.
See the accounting model
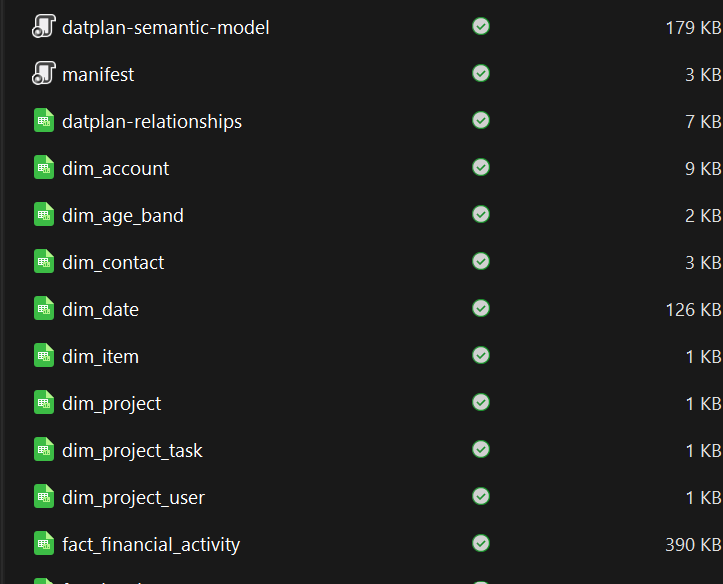
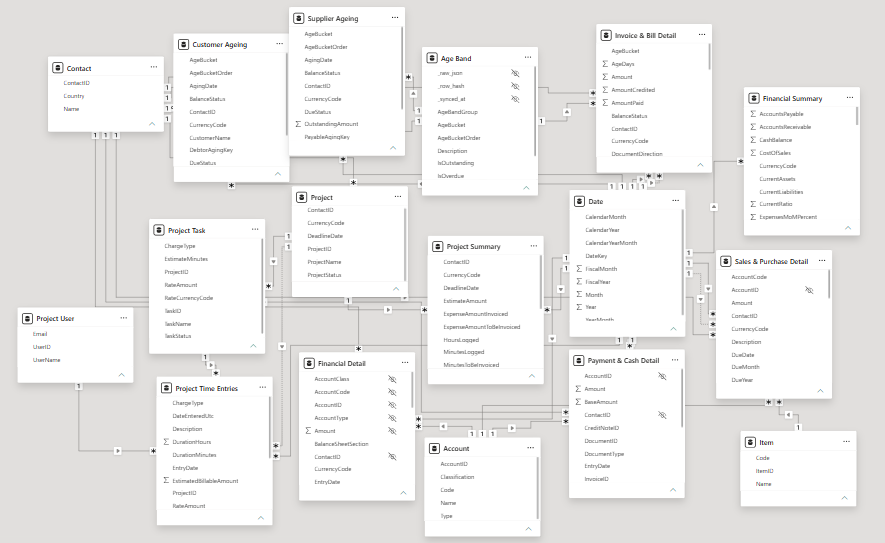
These examples show the exported reporting files and a Power BI Model view built from a Datplan Xero star schema.
Basic or Advanced
Use the curated business areas when you want a smaller reporting model with fewer relationships to manage. It is the better starting point for most first Power BI builds.
Use the broader transformed table set when you need additional detail and are prepared to manage more joins, bridge structures and grain interactions.
Suppose one £1,000 invoice has four lines. If the £1,000 invoice-header amount is repeated after a one-to-many line join and then summed, the report can show £4,000. The fix is not another visual or DAX wrapper: the model needs a measure at the correct grain.
Read the accounting star-schema guide → See the Xero reconciliation workflow →
Connect to stable files, create the documented relationships and build measures around the correct grain.
Use the same prepared facts, dimensions and semantic guidance as a controlled reporting input.
Load the prepared tables while preserving row meaning and avoiding unintended synthetic relationships.
In development
Datplan is developing TallyPrime data pulls and a reporting schema, but Tally support is not part of the current public Windows release. Exact Tally tables and relationships will be documented only when their source fields and accounting semantics are proven.
See the TallyPrime development page → Compare TallyPrime integration options in 2026 →
Inside the BI handoff
A folder full of CSV files is not enough if nobody knows which table owns a measure or how filters should flow.
Supported fact and dimension tables provide the rows Power BI, Tableau or Qlik can load. Stable names make later refreshes easier to manage.
Machine-readable metadata and relationship guidance describe intended table roles, row grain and keys so the first model is not based on filename guesses.
Keep workspaces, sources and organisations distinct unless you have deliberately designed a combined downstream model. Do not mix files simply because column names look similar.
Retain a clear route from a Power BI measure back to the relevant source grain and reporting period. That is more valuable than adding every available table to the model.
The Windows app is free to download and includes Datplan Demo data, so you can test sync, dashboards, reporting grains and exports first.