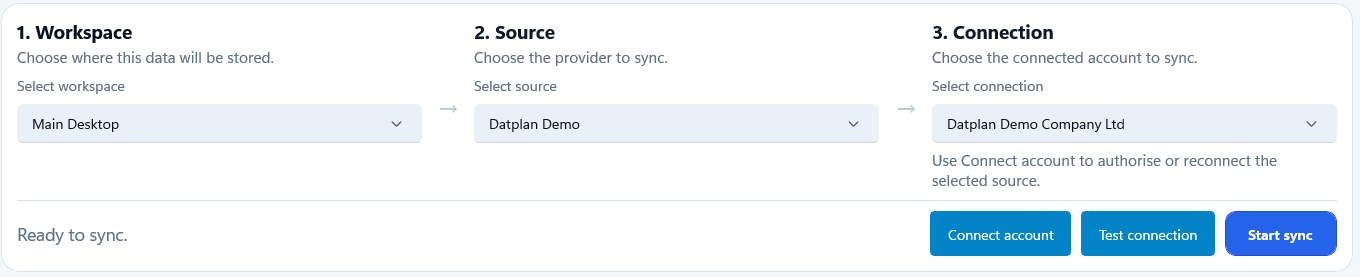
Authorise the source
Choose a workspace and supported source, then complete the provider’s own sign-in and consent flow. Provider passwords are not entered into Datplan.
Privacy-first API reporting for Windows
Pull authorised Xero, QuickBooks, HubSpot and Companies House data, then build your own dashboard by dragging charts, KPIs, tables and text onto the canvas—or export structured files for Excel and Power BI. Start with the free Windows app and included demo data.
The short answer
It replaces repeated API coding and manual export preparation with one controlled desktop workflow: connect an authorised source, sync it, choose the right reporting grain, then create and save your own drag-and-drop dashboard or export stable files for Excel, Power BI, Tableau or Qlik.
The example dashboard is not a fixed template. Add the visuals you want, move and resize them, apply dashboard or chart-level filters, then save and lock the finished layout.
From source to report
Keep each client, source and connection organised in its own workspace and export folder.
Choose a workspace and supported source, then complete the provider’s own sign-in and consent flow. Provider passwords are not entered into Datplan.
Run a standard or full sync. Datplan records endpoint results, run summaries, reconciliation information and the reporting tables created from the source.
Drag charts, KPIs, tables and text onto your own dashboard canvas, resize and filter them, then save the layout—or export CSV, JSON, star-schema tables and BI setup files.
Cloud source, local reporting work
Cloud accounting and CRM systems are excellent systems of record, but finance and reporting work often continues in downloaded files because built-in reports cannot answer every question.
Teams commonly export data into Excel to combine periods, add calculations, create management packs or prepare Power BI reports. The problem is not that Excel is local. The problem is repeatedly downloading, reshaping and replacing files with no consistent reporting grain or refresh evidence.
Datplan provides a simpler controlled route: choose the workspace, source and connection, run the supported pull, then use the local dashboard or export consistently named reporting files.
Built for the reporting question
Invoice value, payment movement, financial statements and CRM pipeline are different questions. Datplan separates the grains so totals are not mixed accidentally.
Use financial summaries for P&L and balance-sheet reporting, invoice headers for totals and ageing, invoice lines for product analysis, and payments for settlement timing.
Explore Xero reporting →Use deals for pipeline value, activities for calls and meetings, companies for account-level reporting, and contacts for lifecycle analysis.
Explore HubSpot reporting →Learn with supplied invoices, lines, payments, bank transactions and journal lines before connecting a live business source.
Use the demo data →Power BI, Tableau and Qlik
Datplan prepares the data layer. Your BI tool remains the presentation and publishing layer.
Datplan does not generate a finished Power BI template or publish data to a BI cloud service. Initial model setup is manual, and any later cloud publishing is a separate action controlled by the user and the BI provider.
This is deliberate: it keeps the source-data workflow visible and avoids describing a file export as a direct, real-time connector.
Privacy is the architecture
Online services still perform the limited account and service controls the app needs. The boundary is explained clearly, not hidden behind a vague “local” claim.
Provider datasets are downloaded through the desktop app to the local app database and user-selected export folders.
Datplan may retain sign-in, source-access, billing, usage, run-state and support records needed to operate the service.
Exports only leave the device when the user stores, shares or publishes them through another tool or location.
Common questions
Datplan DataPull is a Windows desktop app that pulls authorised business data from supported APIs, prepares local reporting tables, builds dashboards, and exports CSV, JSON, fact-and-dimension tables and BI setup files.
No. Source datasets are downloaded through the desktop app to your local PC and local app data. Datplan online services still handle the account, access, billing and usage controls needed to operate the product.
Yes. The Windows app is free to download and includes Datplan Demo data. Paid source plans are required when you connect supported live sources.
Datplan exports stable local reporting files, fact-and-dimension tables and a BI setup package that can be used with Power BI. It is not a native or real-time Power BI connector, and the first BI model setup remains a user-controlled step.
Yes. Select Datplan Demo in the app to test sync, dashboard grains, chart recipes and exports with supplied sample invoices, invoice lines, payments, bank transactions and journal lines.
Yes. Start with your own dashboard canvas, drag charts, KPIs, tables and text into place, resize and configure them, apply dashboard or chart-level filters, then save and lock the finished layout. Website screenshots are examples rather than fixed dashboards.
Yes. After a successful sync, saved Datplan dashboards can use the reporting data already stored on the Windows PC. Internet access is still required to connect or reauthorise a source, retrieve newer source data and complete online service checks.
The Windows app is free to download and includes Datplan Demo data, so you can test sync, dashboards, reporting grains and exports first.